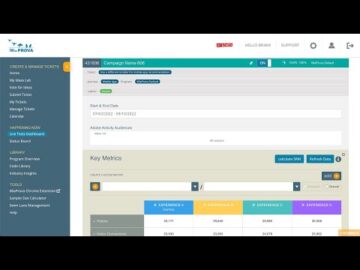
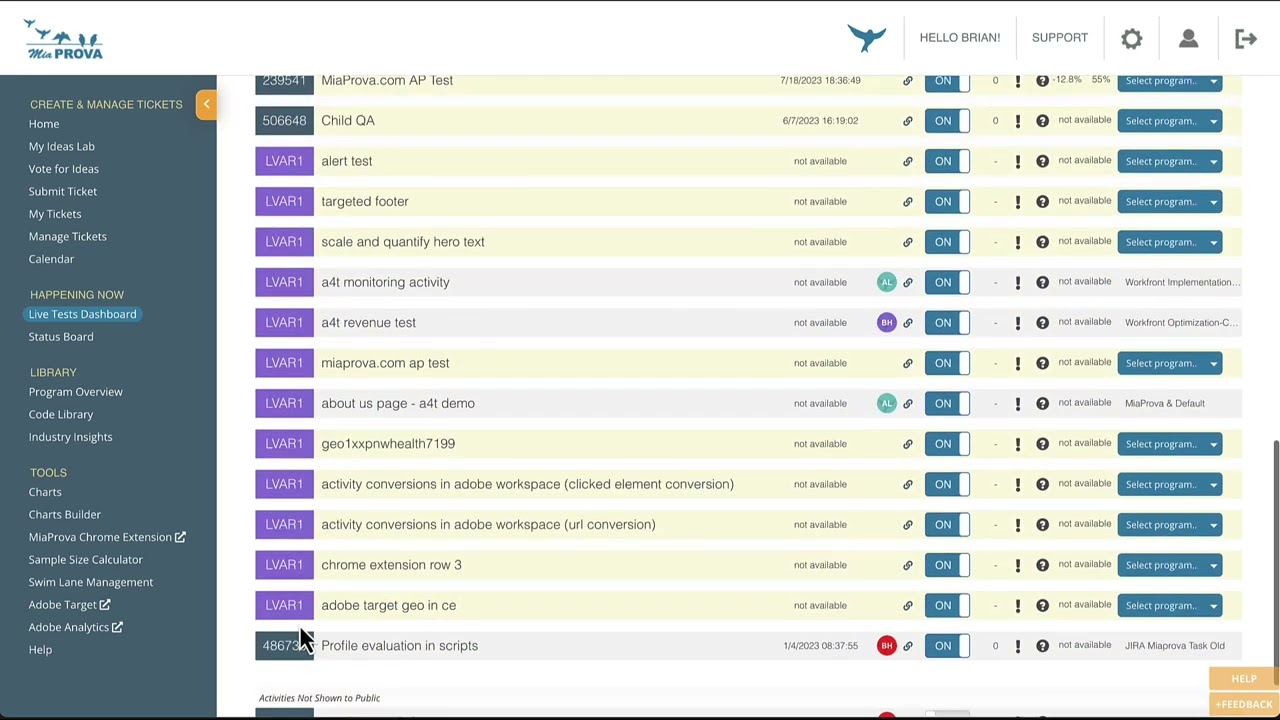
This video provides a brief overview of the Happening Now section of the MiaProva application. Here users can see all live Activities, any associated alerts, and real-time data for A4T and non-A4T Activities.
The MiaProva status board also provides management of all Live Activities and the MiaProva tickets across the various stages of the Activity lifecycle.
Video Transcriptwelcome to mia provo we have a series of
videos for users to familiarize
themselves with our user interface
videos on best practices within
miyaprova miyaprova onboarding and me
appropriate case studies from some of
the cool things some of our customers
are doing the video that we’re covering
here it has to do with our user
interface
specifically the happening now section
within mia prova
which includes the live test dashboard
as well as the status board if there are
any questions or topics that would be
helpful to cover or to elaborate on
please do let us know in the comments
below or email us at support
miaprova.com
and also be sure to follow us on youtube
uh where we share mia provo updates as
well as other helpful items related to
our industry and adobe target lots of
good stuff there on adobe target our
team is very very well versed in in that
technology
okay so the live touch dashboard is one
of the more popular components of the
mia appropriate application
it’s automatically generated so simply
by connecting your mia provo tenant to
adobe io
mia provo will automatically populate
this so as activities are turned on
within the miyaprova
within adobe target they’ll
automatically show up within here which
is nice
you’ll notice some of them are green
some of them are yellow yellow means
that we have an activity
that doesn’t have a ticket associated
with it so mia provo is all about
associating activities
to tickets where we then are able to
automatically create a knowledge library
provide default alerting default
report metrics things along those lines
which is very very helpful
you’ll notice some of these are green
mia prova adheres to industry best
practices when it comes to testing and
one of the fields that we have in our
ticket submissions that was covered in
the previous video
is if we were to provide uh the
estimated sample size so we have a
sample size calculator that will
automatically
come up with a particular value if i
enter this in here
enter the value you see that me approval
will automatically generate the required
sample size
and when tests are live and we have the
sample size data associated with it well
why that it is green we’re also going to
send you an alert via email as well as
an alert within the user interface
that the activity has met the preset
sample size here’s an example of
an above threshold
performance of an activity variation so
we highlight a lot of the alerts uh
within our application within here as
well as the status board which i’ll get
into shortly so this is a wonderful view
where you can see everything that is
live and also manage it against any of
your organizational metadata so in adobe
target you can filter by what type of
activity it is whether it’s a for t or
non a for t and you can you can do that
within here as well
but we also bring in all of the data
from your tickets so if you had
particular journeys that you were
managing different programs developers
being assigned any of your labels custom
filters like you wanted to you just look
at product managers um so really
anything
that you’re using internally can be used
uh
within here uh for for kind of better
and easier management of it you can also
search the activity for any of the code
that’s being used any of the adobe
metadata is available and it’ll be
mapped to the corresponding live
activities that includes the code too
which is really really helpful
clicking on some of these different
activities
you can see several things here we
default to the start and end date based
off of the adobe data we provide what
audiences are getting in we want you to
have quick and easy say oh okay who are
the particular audiences that are
getting in
whether it’s a for t or not a for t the
data is real time
which is very very helpful using the
same apis that you use in
analytics workspace
you can actually calculate the sample
ratio mismatch we do that automatically
but some of our customers wanted to be
able to play with that so we have a
little calculator there for that
um
and then the data is distributed across
the various experiences which is helpful
i i again this is real time but the
default view for this data
is 100 customizable uh that’ll be in the
videos with the admin console
specifically the the reporting
um and it’s journey specific so mia
prova is a journey-centric optimization
management platform so
if if you have customers that belong to
one journey automatically mia provo will
provide that default reporting view
uh for that particular journey the
metrics in in the configuration of the
data grid uh for all of your journeys
and all of the alerting that we saw like
within the performance all of those will
be
journey specific as well which is great
uh mia provo does a lot of other things
which is really really helpful we
calculate the uh lift and confident
confidence levels automatically so for
those of you that use the a4t
panel and analytics workspace i think
you’ll find this to be very very helpful
we also
provide mechanisms for
commentary so a lot of our customers
will
will add comments in here
when a test is live which is really
helpful
to provide visibility you could tag
people tag groups within here and will
automatically send those notifications
and what’s nice is this this rich
commentary during the in-flight test
will automatically become part of the
knowledge library so if users are
searching on different things
the activities that have that metadata
will show up within here
now
our team
many many years of consulting and so
while we love this
summary view of the data
we also default to
a day by day view where you can see the
data over time against your various
metrics that are specific to your
journey this is a
demo account so it’s kind of like play
data but this is very very helpful to
unders understand trends or particular
issues that might be going on with the
activity also really helpful to
demonstrate
statistical confidence you can show kind
of consistent behavior of experiences
over time
very interactive
grid where you can kind of play with
things as you wish and again all of the
metrics here are related to uh whatever
the journey that’s been defined in the
application
and then we also have the ability to
kind of have just quick screenshots
available within here
if organizations would like we could
automatically bring in the offer code
and make that available that’s something
we automate as well um but this is a an
option to use the screenshot so really
really helpful companies will come in
here they can see how things are doing
at a glance and all of these top-level
metrics
are reflective of that particular
journey all customizable within the
admin console
and i said earlier this is how you can
quickly and easily associate tickets uh
with activities and
one of the very helpful things that mia
provo does is we provide organizational
visibility into how companies are using
adobe target
adobe target in my opinion is is
probably one of the best content
management systems out there even though
it wasn’t originally designed to be
because it gives organizations and
marketing teams the ability to quickly
and easily target and change content on
the site or it will be using it for
patches or bug pitches or
operationalizing winners so this is a
wonderful way
to flag these different efforts okay
this is operational so we flag it as
such we’ve got the data with this we
save and then we just flagged it so now
reports can be generated for
organizations to show how they’re using
adobe target over time
to
identify
[Music]
opportunities in areas for growth and
things along those lines so we want to
make sure that everything gets credited
uh within there and so we we allowed
that quick flat flagging functionality
so this is the
in flight
populated by adobe um or data from adobe
analytics we can treat evars and and
different analytics variables as inputs
as well
we also provide the status board view
this is a very popular view where you
can manage everything
again this column is is
generated by adobe it’s it’s activities
or data collected from adobe analytics
but here you can manage your ideas your
you could prioritize idea against any of
your metadata all of your different
filters labels all that good stuff if
you wanted to look at okay show me all
the uh where ted is the product manager
so you can see all of the things across
his various states let me just clear all
the filters here
um so submitted tickets is kind of what
i said it let me let me make this a
little bit smaller there so here you can
see all of your tickets you can click on
the bottom of any of these cards it’ll
break up the bring up the side panel you
can quickly assign a developer all of
the commentary any tasks that you wish
to include within here
you can also
test managers can prioritize their
tickets as they wish which is very very
helpful
for those organizations that adopt a
journey-centric program what they’ll do
is they’ll kind of look at the different
journeys where things are going on and
kind of manage things along those lines
within there
again green means sample size has been
hit so a lot of companies will use our
status board to discuss next steps for
these ones that are green they hit their
sample size which means we have an
opportunity to get something else in its
place because we’ve got our answers that
we need here you can see some of the
alerts that are being highlighted
in the commentary as well
uh other things that are very helpful
here within the
status board is tickets that are under a
waiting summary we can click on the
bottom of the activity
the bottom of the card and we can have
all of the live activities here
to make it easy for organizations to
quickly and easily make the marriage
happen between a mia provo ticket and an
adobe target activity or data that comes
from adobe analytics
organizations can also
easily take to uh create tickets across
any of the various states within mia
provo we don’t force
organizations down a rigid um
path for example the visual editor in
adobe target makes it quick very easy to
get tests up and running
uh and if this was a test that was on
the fly it’s kind of silly to go ahead
and create a ticket under submitted
assign it to a developer and then move
that ticket you know to a waiting
summary it’s kind of kind of silly
when you can just create a ticket within
a waiting summary within here
often organizations do that
the other helpful thing that i wanted to
highlight here is the ability to copy
tickets
for example if you had a ticket if
you’re running a series of tests or you
ran an old test where all the ticket
data was filled out
you could just find that ticket within
here be able to quickly and easily copy
it
and move it to the respective state that
you wish within there that’s something
that a lot of organizations find very
very helpful um you could click on the
tickets within here uh ticket names it
brings you to
um you know the respective ticket
and the same thing goes for the
different categories you could submit
and get the shortcut to the to the
various categories um the search is
across all of the adobe metadata
including your offers your audiences
any of the code i said that’s been
included as well as any of the
organizational metadata that’s within
your tickets and so a lot of teams will
have uh this section of mia provo as
part of their you know daily stand-up or
weekly review in terms of what things
are in flight what things are coming
to help advance tickets um
through these various states to get to
the archive ticket program overview
where you can see the program impact and
all of that wonderful stuff is in place
there so any questions please hit us up
thank you for watching
Leave a Reply